Windows Event Log Setting

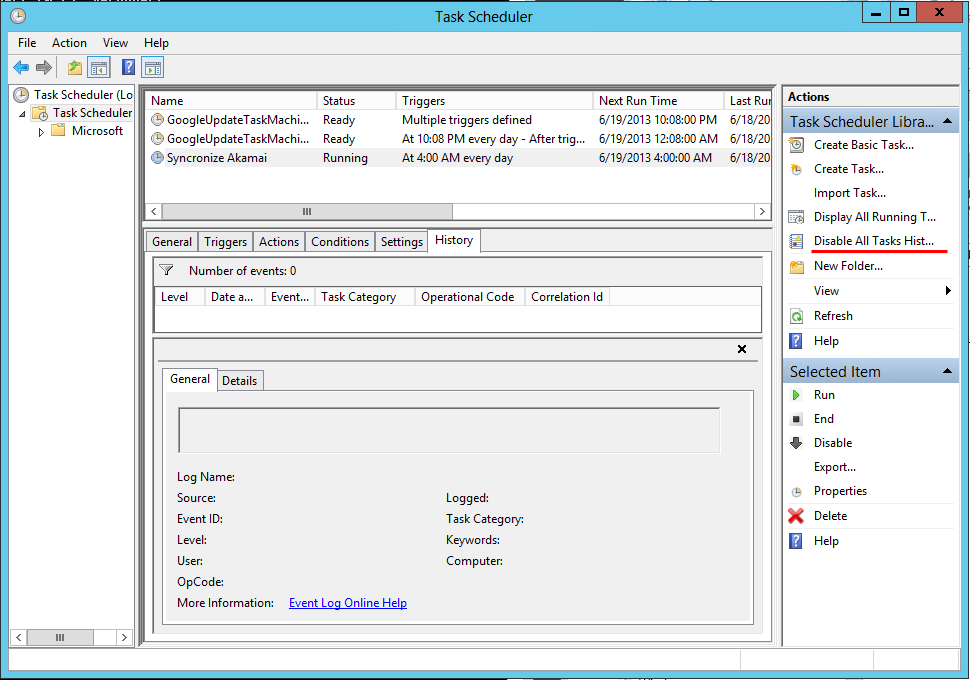
As you might know, Windows Event Log is not properly logged by default setting. Once you meet a computer incident, if you want to get valuable information from Windows, you need to adjust configuration. Here is a script I used.

auditpol /set /category:"Account Logon" /success:enable /failure:enable
auditpol /set /category:"Account Management" /success:enable /failure:enable
auditpol /set /category:"Detailed Tracking" /success:enable /failure:enable
auditpol /set /category:"DS Access" /success:enable /failure:enable
auditpol /set /category:"Logon/Logoff" /success:enable /failure:enable
auditpol /set /category:"Object Access" /success:enable /failure:disable
auditpol /set /category:"Policy Change" /success:enable /failure:enable
auditpol /set /category:"Privilege Use" /success:enable /failure:enable
auditpol /set /category:"System" /success:enable /failure:enable
auditpol /set /subcategory:"Filtering Platform Connection" /success:disable /failure:disable
auditpol /set /subcategory:"Filtering Platform Packet Drop" /success:disable /failure:disable

I disabled the failure of Object Access and regarding filtering platform, because these generates a lot of logs unnecessarily. Of course, if you afford to store these kind of logs, you can enable them.


Load Balancing on Syslog-ng

When you want to send logs to specific logging servers at least two more to be load balancing, you can use Syslog-ng with the configuration as below. Deciding server where you send a log is depended on the last digit number of the system uptime. Here is a sample Syslog-ng configuration file for aforementioned the load balance.

filter f_0 {
   match("[0-9]*[02468]$" value("SYSUPTIME"));
};

filter f_1 {
      match("[0-9]*[13579]$" value("SYSUPTIME"));
};

log { source(s_fw); filter(f_0); destination(d_redis0); };
log { source(s_fw); filter(f_1); destination(d_redis1); };


Forensically Sound Windows

I called “Forensically Sound Environment” as an operating system is good at logging or tracing for analysis to a specific case in terms of forensic or incident response. Here are some configurations to make forensically sound environment.

Prerequisite

  1. Sync date and time to localtime or UTC

Windows

Most of configurations are Windows artifacts. Of course, it’s included that application such as IIS, Windows Advanced Firewall ans so on, however we can’t get any evidence from them unless you set those configurations properly like forensically sound environment.

  1. EnablePrefetcher
  2. NtfsDisableLastAccessUpdate
  3. $LogFile
  4. Windows Recovery
  5. Minidump
  6. Windows Event Log
  7. WinRM service
  8. Event Tracing for Windows
  9. C:\> openfiles /local on
  10. Windows Advanced Firewall
  11. Application Log
    1. IIS
    2. Anti-Virus
    3. Adobe Reader

Linux

  1. Auditd
  2. iptables logging

Post Task

  1. Build MD5 white-list
  2. Logging remotely

I will describe about each title as above in more detail. And I’ll put the link on the title on this page. I hope that I want to make the list in question with you.

Base Splunk query on indexing time

If you manage Splunk, you might want to know when the log is indexed. Basically we can know when the log was generated by means of _time keyword, however it’s not indicated indexing time. _indextime indicates indexing time.

Here is a sample to compare the result of using between _time and _indextime. As you can see the graph below, lots of log for 5 days at least was collected at 18th Mar. 2015.

_indextime
your query | fillnull | eval _tme = _indextime | timechart cont=t usenull=f useother=f span=1d count by cs_host


_time
y
our query | timechart usenull=f useother=f span=1d count by cs_host

Change Linux timezone

If you want to change Linux system timezone such as CST, KST and so on, follow following steps. But, you should know the string of timezone you want to change. You can search at this site – http://www.timezoneconverter.com/cgi-bin/zoneinfo

# Confirm current setting information of the system about timezone

$ date
$ cat /etc/timezone

# I gonna to change it’s timezone to CET and synchronize
$ echo “Europe/Luxembourg” | tee /etc/timezone
$ cat /etc/timezone
$ dpkg-reconfiure —frontend noninteractive tzdata

# Check if the value is changed
$ date


Export Win Tasks List to CSV

If you want to check all of Windows Task Schedulers at a glance, you can do this by using schtasks.exe which is a Windows default system program in C:\Windows\System32\.

C:\> schtasks.exe /Query /FO CSV /V > %COMPUTERNAME%_%DATE%_schtasks.csv

Once you set /FO option as CSV format, you can read this result by Excel. And you can see the title of each column if you use a /NH option.  Here is a sample about the columns.

  1. TaskName
  2. Next Run Time
  3. Status
  4. Logon Mode
  5. Last Run Time
  6. Last Result
  7. Author
  8. Task To Run
  9. Start In
  10. Comment
  11. Scheduled Task State
  12. Idle Time
  13. Power Management
  14. Run As User
  15. Delete Task If Not Rescheduled
  16. Stop Task If Runs X Hours and X Mins
  17. Schedule
  18. Schedule Type
  19. Start Time
  20. Start Date
  21. End Date
  22. Days
  23. Months
  24. Repeat: Every
  25. Repeat: Until: Time
  26. Repeat: Until: Duration
  27. Repeat: Stop If Still Running

Especially, I focus two columns, “3. Status” and “14. Run As User” in terms of incident response.

How to enable the history of the Windows Tasks Scheduler

There are many options in a program or operating system but most people didn’t take care of those. Actually, the options are very helpful to debugging or troubleshooting. And I think that we need to prepare what is the options before under the attack by hacker.

Here, there is an option which is default disabled. It’s the history of the Windows Tasks Scheduler. This option show us the chronological list of a task. Should set the option enabled, if you want to show the history,

Tasks_Schedule