
Regarding Alert and Monitoring, in fact it has quite different meaning between them literally. Alert is a warning or alarm of something wrong or suspicious what you want to be aware. Monitoring is to watch closely for specific purposes.
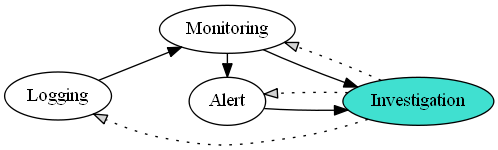
Security Activity Relationship
digraph {
  rankdir=LR
  L [label="Logging"]
  M [label="Monitoring"]
  A [label="Alert"]
  I [label="Investigation" style=filled fillcolor=turquoise]
    L -> M
    M -> A
    M -> I
    A -> I
    I -> L [style=dotted fillcolor=lightgray]
    I -> A [style=dotted fillcolor=lightgray]
    I -> M [style=dotted fillcolor=lightgray]
  {rank=same A M}
}
However it is not difficult to see mixing those signification between them in terms of computer security. For instance, someone made an alert which was issued by email for just looking login history. It’s not bad, but we most likely ignore this kind of email if there are too much them in your inbox. It’s a problem.
In my opinion, Alert has an threshold and Monitoring has an ability to aware of out-of-data by using visibility.
In terms of security, alert is occurred when over a specific threshold. For example, if login requests in a IP address over 100 in a second, an alert will be happened to notice there were suspicious logins. It might be an login brute force attack. With this alert, we are going to investigate if it is an attack or not. In this respect, we need to know variant attacks in order to decide the exact threshold.
On the other hands, monitoring is looking at suspicious one like out-of-data. For example, we usually adopt binary-entropy in order to come up with out-of-data among lots of normal PE(Portable Executable)

